PREDICTIVE SUPPORT HUB
3,000 support agents were navigating 32 legacy tools on every call. What looked like a UX problem was an infrastructure problem wearing a UX mask. The solution was not a better interface, but to eliminate the reason the interface was so complex to begin with.
I was brought in to redesign the support experience for a global telecom with 3,000 agents across multiple countries. The initial brief was UX improvement. What the audit revealed was that every customer call required agents to context-switch across an average of 32 separate legacy tools to find billing history, technical data and open tickets. There was no single source of truth. The problem was not the interface.
End-to-end ownership from field research and systemic audit to AI orchestration design and agent workflow redesign. I reframed the problem, built the infrastructure cost model that unlocked the investment, and led the solution architecture.
AHT reduced from 10 minutes to 3 minutes per call (70% reduction, measured across the post-launch agent cohort). 32 legacy tools replaced by one intelligent workspace. At 3,000 agents handling an average of 40 calls per day, the 7-minute AHT saving per call represents roughly 14,000 agent-hours recovered daily. New agent onboarding cut from 3 days to under half a day.
Client identity omitted per NDA. Strategic challenges, decisions and outcomes are accurate.
AHT reduction. From 10 min to 3 min per call, measured post-launch across the agent cohort. At 3,000 agents × 40 calls/day, this is ~14,000 agent-hours recovered daily.
Legacy tools consolidated into one intelligent workspace. Tool count audited pre-project; consolidation confirmed at launch.
New agent onboarding time. Baseline from ops documentation; post-launch figure from first onboarding cohort on the new system.
Agents navigated between dozens of disconnected legacy systems on every call. Billing lived in one tool. Technical data in another. Tickets in a third. There was no shared context, no single customer view and no way to act without opening another window. Institutional knowledge lived on sticky notes next to monitors.
The two screens below are from the legacy environment. One is a raw account management tool that agents used to look up customer data. Dense, technical, built for system administrators rather than support agents. The other is a bill detail view accessed through a separate portal. These are two of the 32 tools an agent was expected to navigate mid-call.
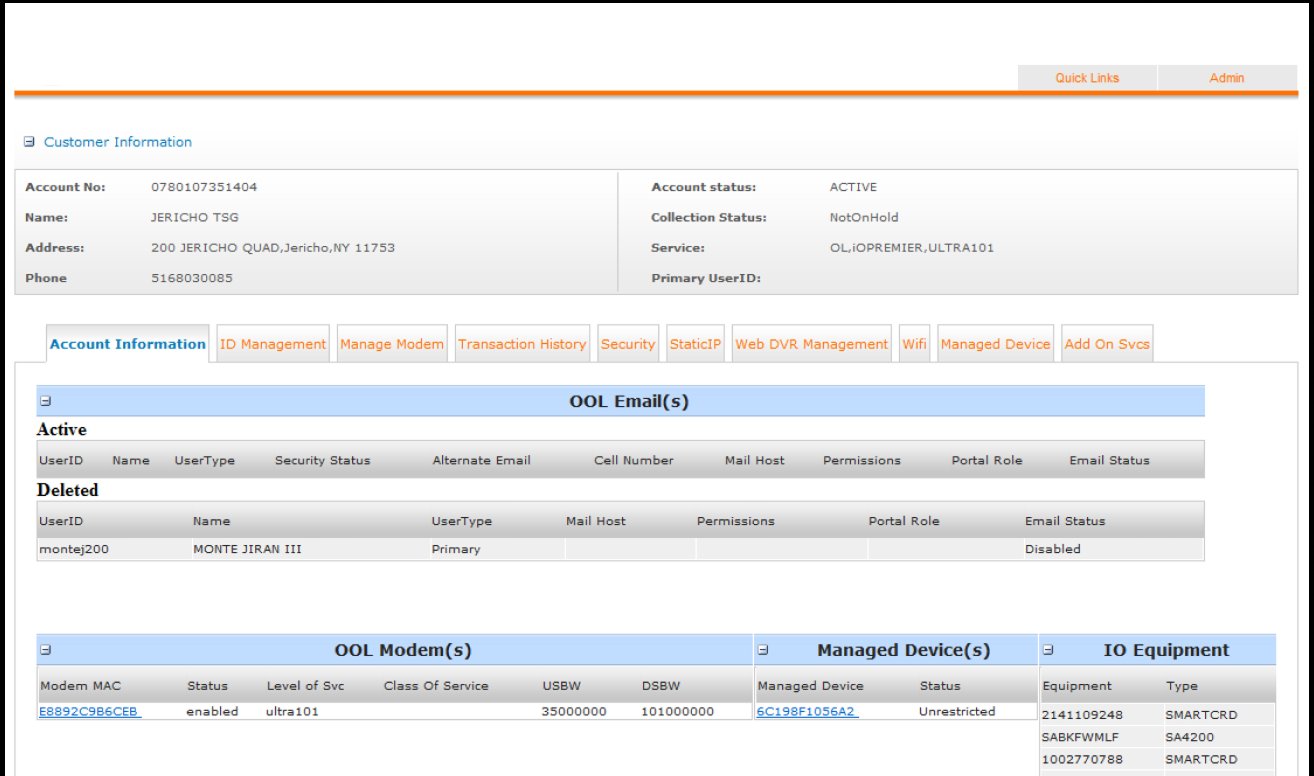
Legacy account management tool. Agent lookup for customer data built for sysadmins, not support agents on a live call.
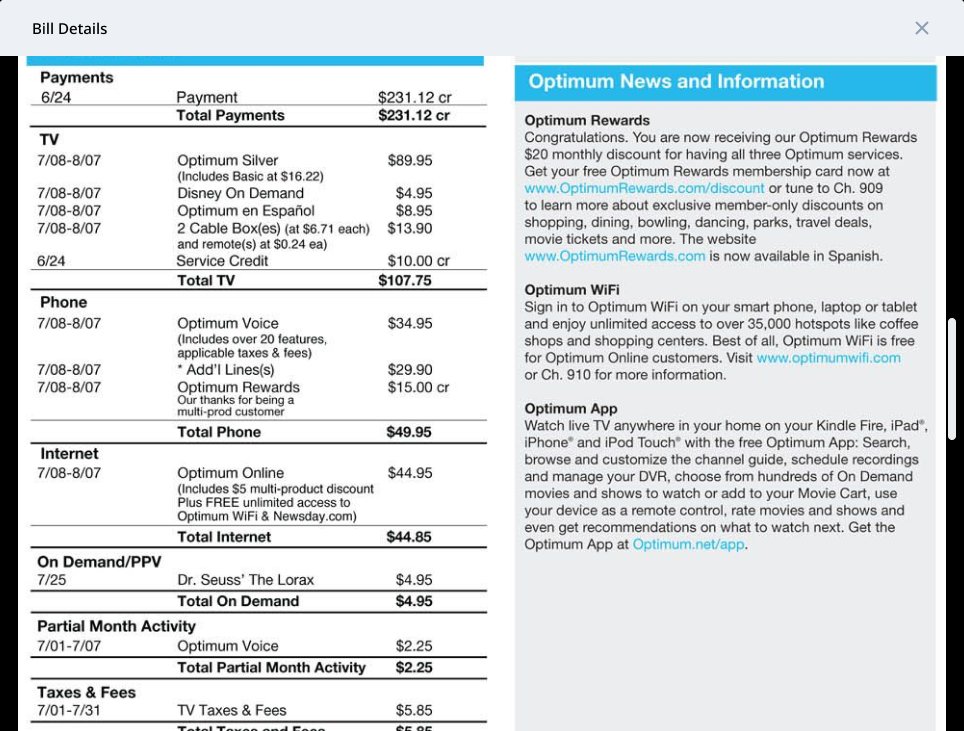
Legacy bill detail view accessed through a separate portal. One of many tools an agent toggled between per call.
Legacy tool map (sample)
12 of the 32 tools an agent navigated per call. Red: accessed on every call. Gray: situational.
Remote sessions with agents in Egypt and Jamaica: screen observation and live call listening. Then on-site in New York and Texas: shadow sessions on the floor, no questions during calls, debrief after. Participants were sampled across tenure, new hires under 6 months, agents with 2 to 5 years, team leads. Remote showed us what people do, on-site showed why.
What became clear across every location was that the tools were actively fighting each other. The institutional knowledge that should have lived in the system lived on paper instead. New agents spent months just learning the map. When I brought this back to the client, the picture was new to them. They understood the fragmentation but had not seen it mapped as a cost. That conversation reframed the project from interface improvement to infrastructure investment.
This was not a UX problem. It was an infrastructure problem wearing a UX mask.
The client understood the fragmentation. They were not convinced it justified the investment.
I built a cost model. The inputs were public: average AHT of 10 minutes per call, call volume across 3,000 agents, cost per agent-hour. The output was a single number, the annual cost of the fragmentation in lost agent time, compared against the projected engineering cost of consolidation. We were not asking to approve a design preference, we were asking to reevaluate an infrastructure ROI, and that shift in conversation unlocked the project.
Infrastructure cost model
The argument that reframed the project. Fragmentation cost modelled as AHT delta × call volume × 3,000 agents × cost per agent-hour.
The workspace replaced all 32 tools with three layers. Auto-identification surfaced the customer's full history on call connect: name, account, interaction history, open tickets. All without the agent searching. Contextual scripting monitored the call in real time and pushed relevant data and suggested responses to the agent. Live resolution surfaced the answer directly in the session interface.
The auto-identification panel is the first screen an agent sees when a call connects. By the time they say hello, they already know who they are talking to, why that customer likely called and what the last three agents did.
The full unified workspace. Every data source previously spread across 32 tools available in a single view, mid-call. The agent's job becomes the customer, not the system.
The workspace is desktop-only by design and by constraint. Support agents work from fixed workstations in call centres. A mobile version was out of scope and would have been the wrong call, the data density required to serve a call in under 3 minutes does not fit a phone screen. Designing within that constraint produced a better desktop product than designing for all contexts would have.
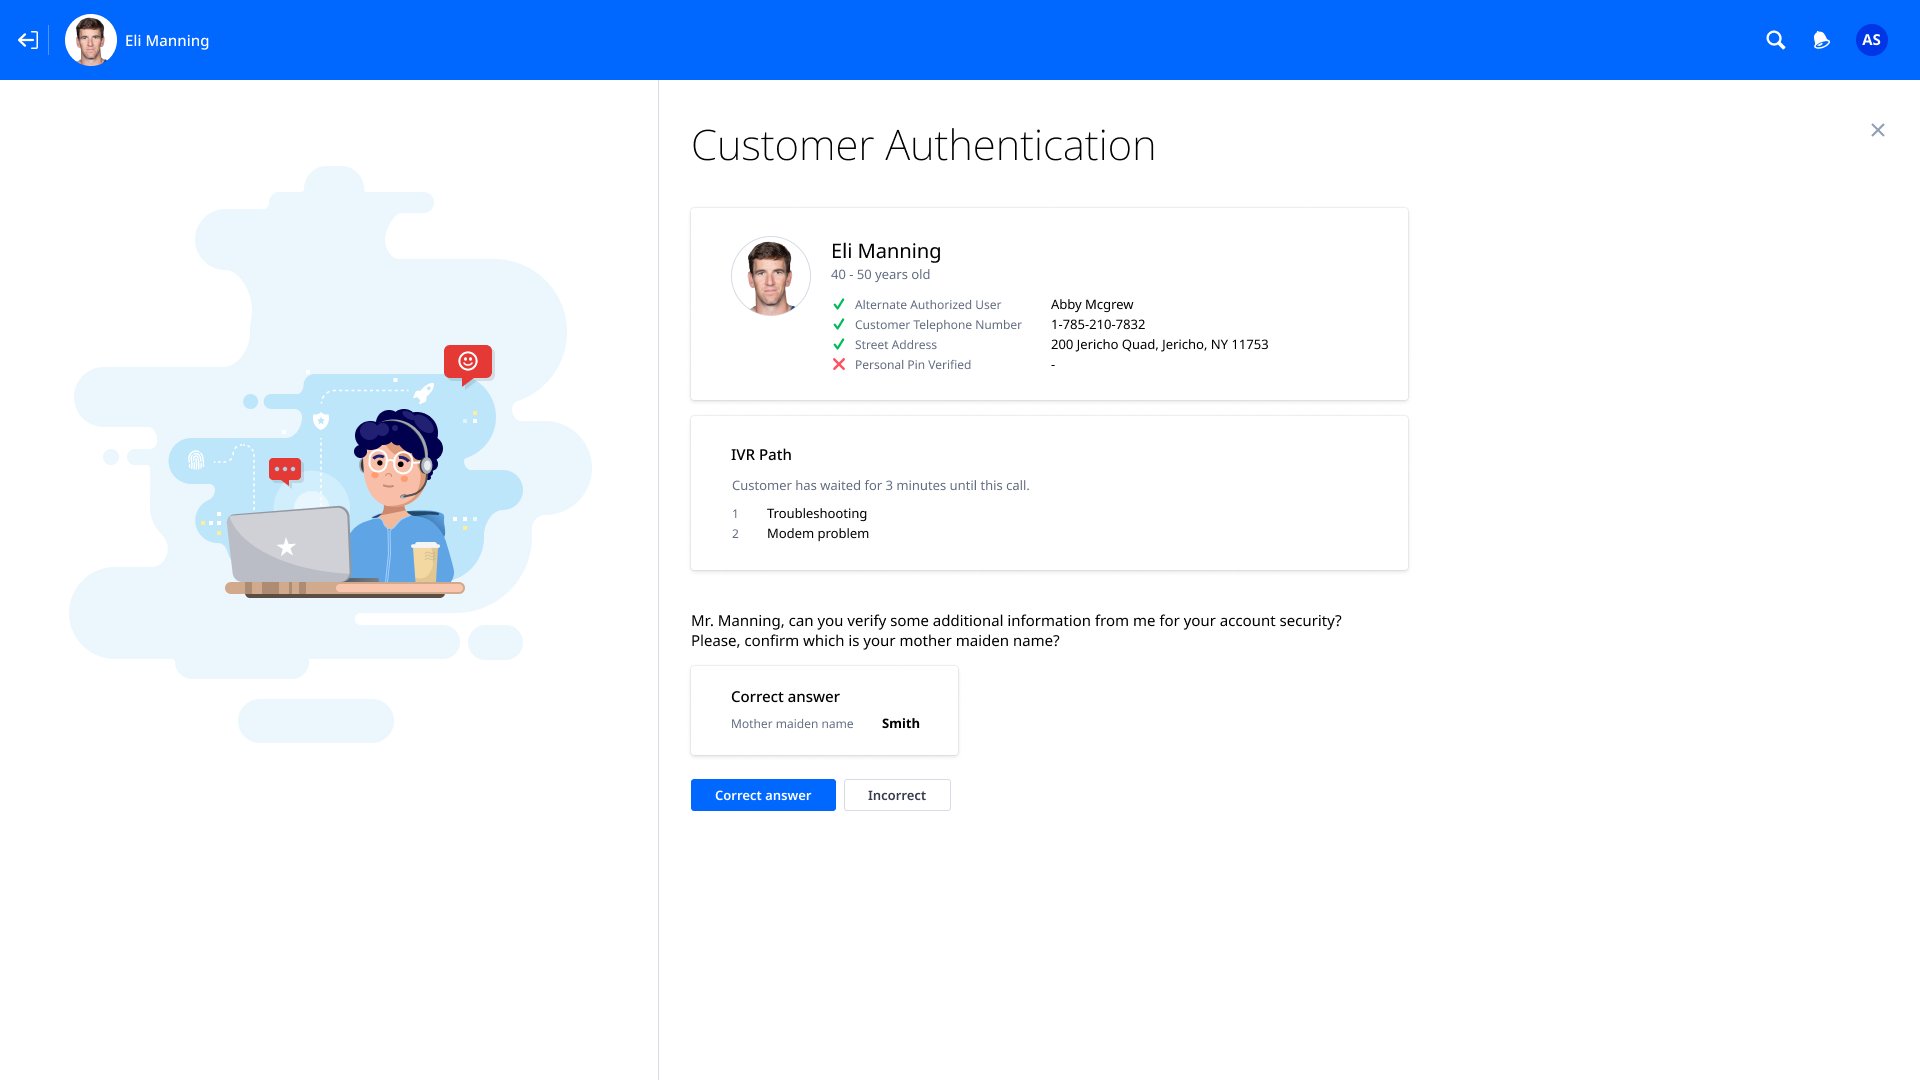
Auto-identification panel on call connect. Customer history, IVR path and authentication surfaced before the agent speaks.
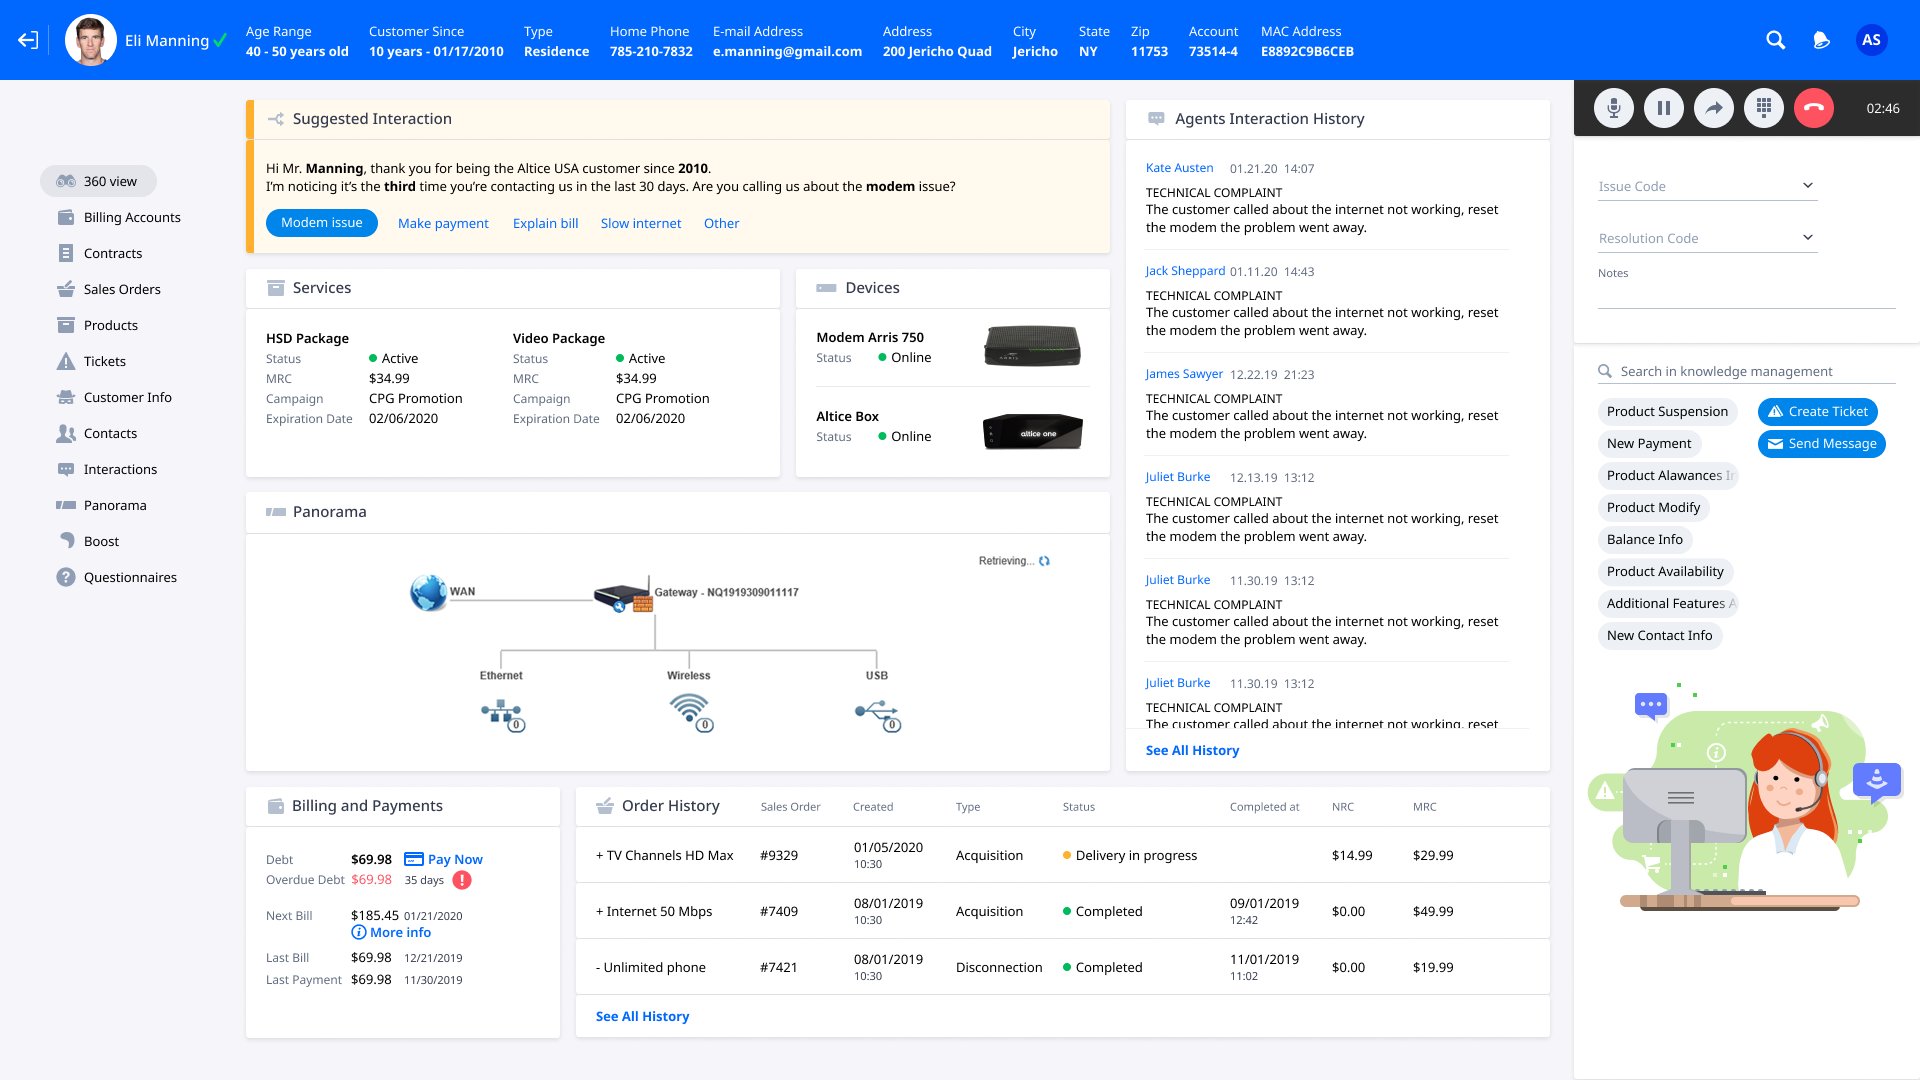
Unified agent workspace. Customer context, suggested interaction, services, devices and billing. One screen, mid-call.
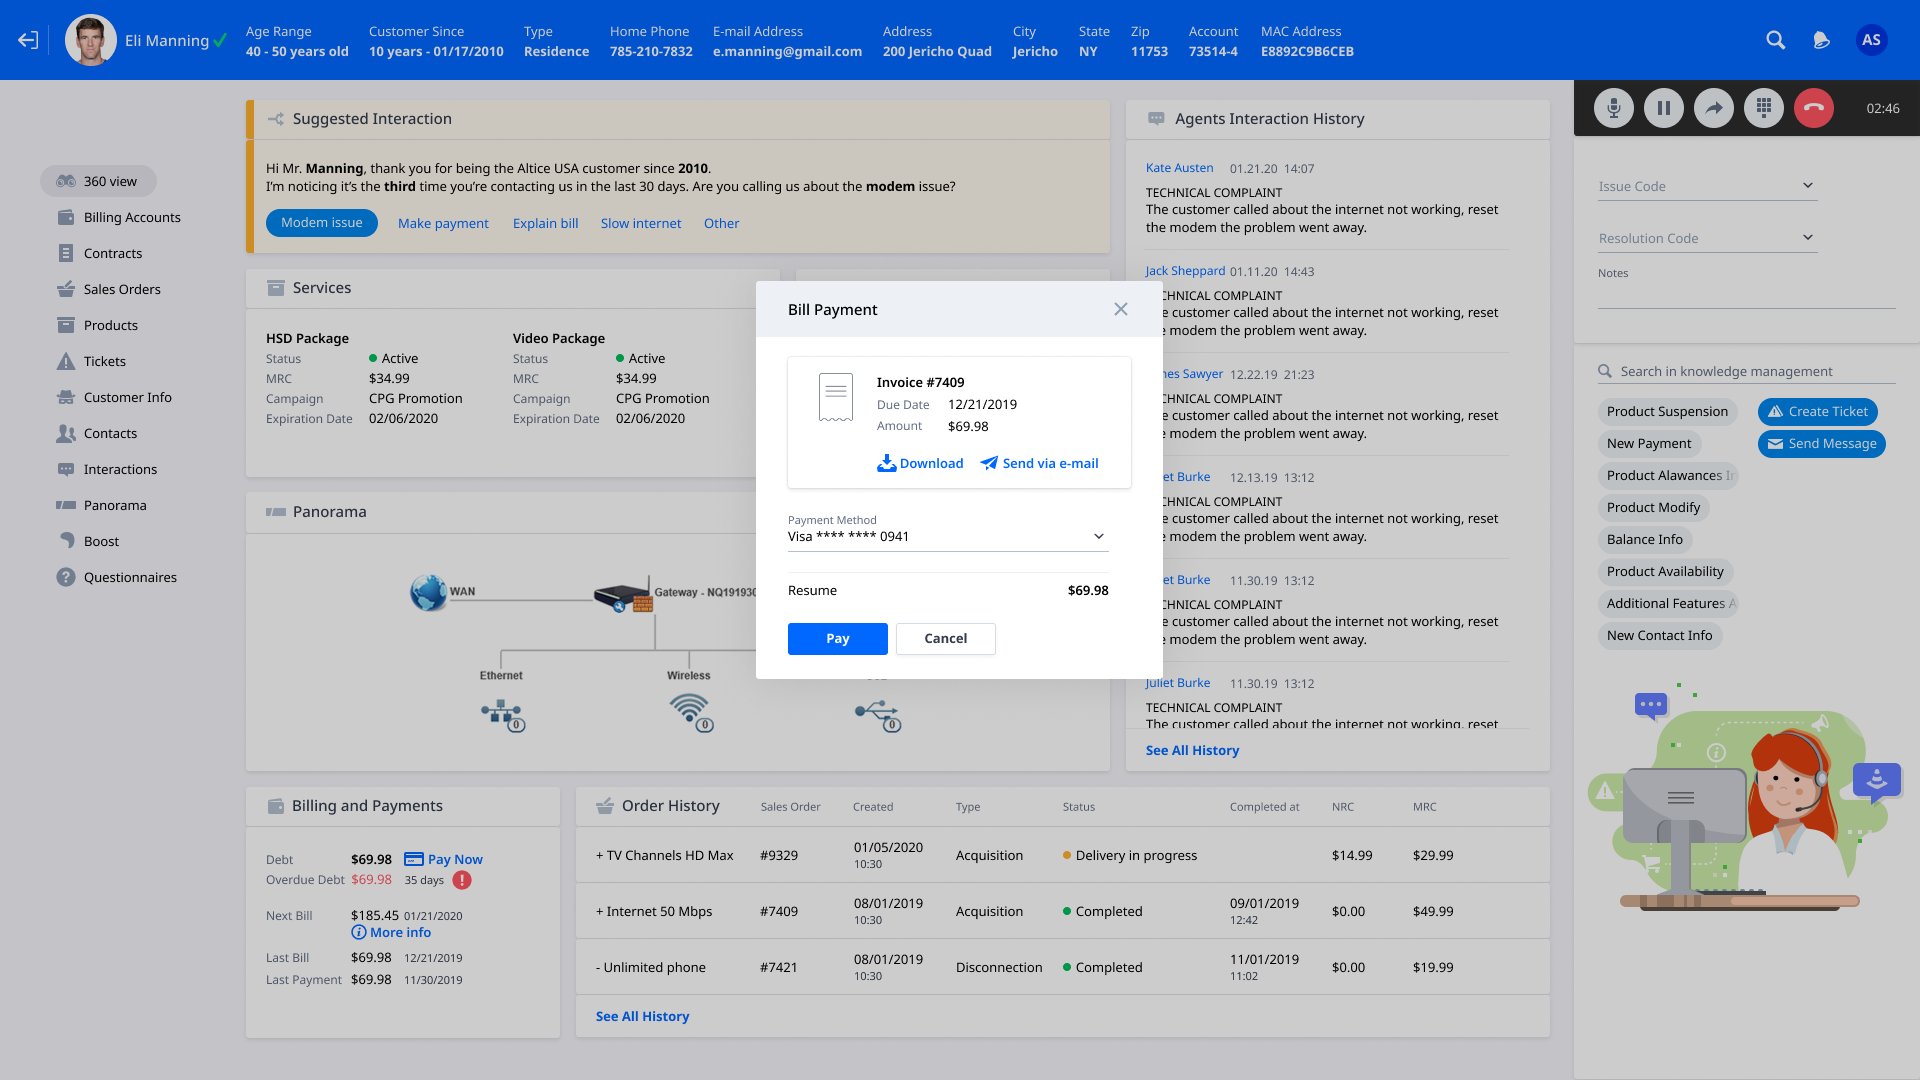
Workspace with bill payment modal active. Action completed without leaving the interface.
Unified workspace: three intelligence layers
Auto-identification, contextual scripting, live resolution. Each layer replaces a category of legacy tools.
3,000 agents is a different design problem than 300. Every interaction pattern decision compounds. A 2-second inefficiency per call, multiplied across 3,000 agents doing 40 calls a day, is 240,000 seconds of lost productivity daily, nearly 67 agent-hours. That arithmetic shaped every micro-decision: the number of clicks to reach a record, the placement of the most-used action, the time it takes the auto-id panel to render.
Accessibility at this scale is a performance constraint. An agent who relies on keyboard navigation to move through a queue cannot afford a focus trap. An agent with low vision cannot afford a notification that only uses color. The workspace was designed with full keyboard operability, visible focus states at 3:1 minimum contrast, and status indicators that pair color with text. These were specced as first-class requirements alongside the interaction patterns.
At this scale, a bad deploy does not affect a team affects an entire operations center. The workspace was built to coexist with the legacy tools, not replace them in a single cutover. Agents migrated cohort by cohort, with the legacy tools still accessible during the transition window. That architecture decision was made during the design phase.
At 3,000 agents, the 7-minute AHT saving per call recovers 14,000 agent-hours daily. The same discipline applied at 10M users changes churn numbers, not handle time. The arithmetic is different, but the principle is identical. Every design decision is a business outcome decision.