B2B SALES RESCUE
Two releases had shipped without a designer. When we arrived and said parts needed reworking, the client's management pushed back hard. The work we had done to get there was the only thing that made the conversation possible.
I joined this project after two releases had already shipped without a designer. The result was a fragmented quoting system that forced sales agents to navigate 7 different tools to generate a single customer proposal. Agents handled up to 10 proposals per day. The math did not add up.
Owned the full design process from embedded field research and stakeholder alignment through interaction design, usability testing and executive prioritization. Led a one-month on-site research study and built the prioritization framework that secured leadership buy-in.
Time-to-proposal reduced from 1 hour to 15 minutes, measured across 37 agent interviews and timed task observations during the research study. 7 tools replaced by a single 3-step flow. New agent onboarding cut from 3 days to under half a day, validated with a post-launch cohort of 12 new hires.
Client identity omitted per NDA. Strategic challenges, decisions and outcomes are accurate.
Quote time reduction. Baseline: ~60 min per proposal observed across 20 shadow sessions. Post-launch: ~15 min, timed with the same agent cohort.
Tools replaced by a single unified flow. Verified against the pre-launch tool audit and confirmed in post-launch agent interviews.
Faster onboarding. Baseline: 3-day training program documented by ops. Post-launch: under half a day, validated with a cohort of 12 new hires.
The interviews told us what agents thought they did. The shadow sessions showed us what they actually did.
One month on-site in São Paulo. 37 interviews, 25 usability tests, 20 shadow sessions.
Participants were recruited from the client's ops team: senior agents, new hires under 3 months, team leads, one regional manager per location. Interviews were semi-structured. Usability tests ran timed task scenarios. Shadow sessions were observation only, no questions during, debrief after.
The most significant finding did not come from the interviews. It came from watching agents work: they captured all the information for a quotation before opening the system, often in notes or spreadsheets, and then entered it manually. The system had been designed around the assumption that agents would configure products as they went. Almost no one did.
Several features that management considered important had near-zero usage in the field. Some agents did not know what they were. The data required careful framing to bring back.
Research methodology breakdown
37 interviews, 25 usability tests, 20 shadow sessions. The key finding (agents pre-filling quotes offline) only surfaced through observation.
The client's management pushed back. Two releases had shipped. Having an external team arrive and say parts needed reworking was not a comfortable conversation.
We scored every finding on two axes: criticality by Nielsen's severity scale, and effort by design and development cost combined. The output was not a list of problems. It was a roadmap argument. Low-effort, high-criticality fixes first, slotted into the existing release schedule so the rework did not require stopping. The constraint that turned the room was not the severity scores. It was the framing that the system had to keep running. We were not proposing a replacement. We were proposing fixes that could be absorbed into releases that were already scheduled. Management agreed to incremental changes over a reviewed and approved roadmap.
Management agreed to incremental changes absorbed into the existing release schedule. That was the specific outcome: not a redesign project, not a new budget line, fixes slotted into releases that were already planned. The constraint was the argument. The roadmap was the proof.
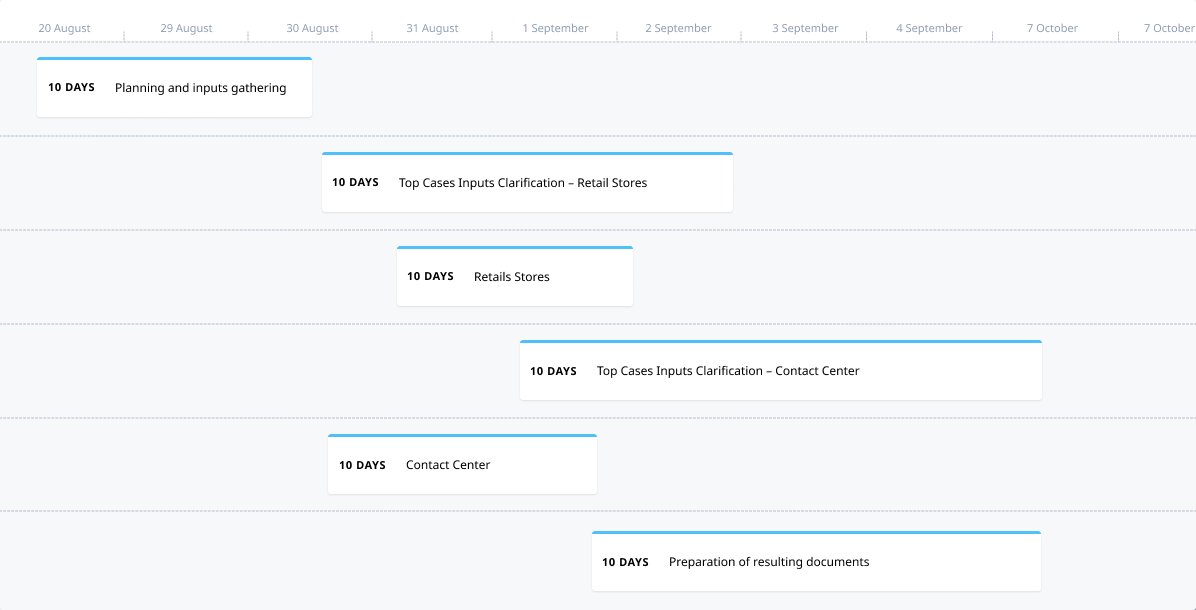
Research-to-delivery roadmap. Planning, top-case inputs by segment, and documentation phases structured around what the field study revealed.
Criticality vs effort prioritisation matrix
Every finding scored on Nielsen severity and implementation effort. The matrix output was a roadmap, not a to-do list.
Most agents used a small set of predefined configurations. Only major clients required custom plans. The product had been designed for the complex case and applied it to everyone.
The flow runs on desktop and tablet. Sales agents work from office machines during client visits; the tablet version was validated on-site. Mobile was out of scope by product decision, the client's CRM infrastructure did not support mobile authentication at the time. That constraint was documented and accepted in the first stakeholder review.
Time-to-proposal dropped from 60 minutes to 15. Seven tools became one flow. New agent onboarding went from three days to half a day. The product had been designed for the complex case and applied it to everyone. The fix was to design for how agents actually worked.
The express flow was designed for keyboard operability throughout. Sales agents move quickly between fields during client calls, mouse navigation at that speed creates errors. Tab order follows the logical quote-building sequence. Every state change, product added, pricing calculated, approval triggered, produces a visible focus indicator so the agent always knows where they are in the flow.
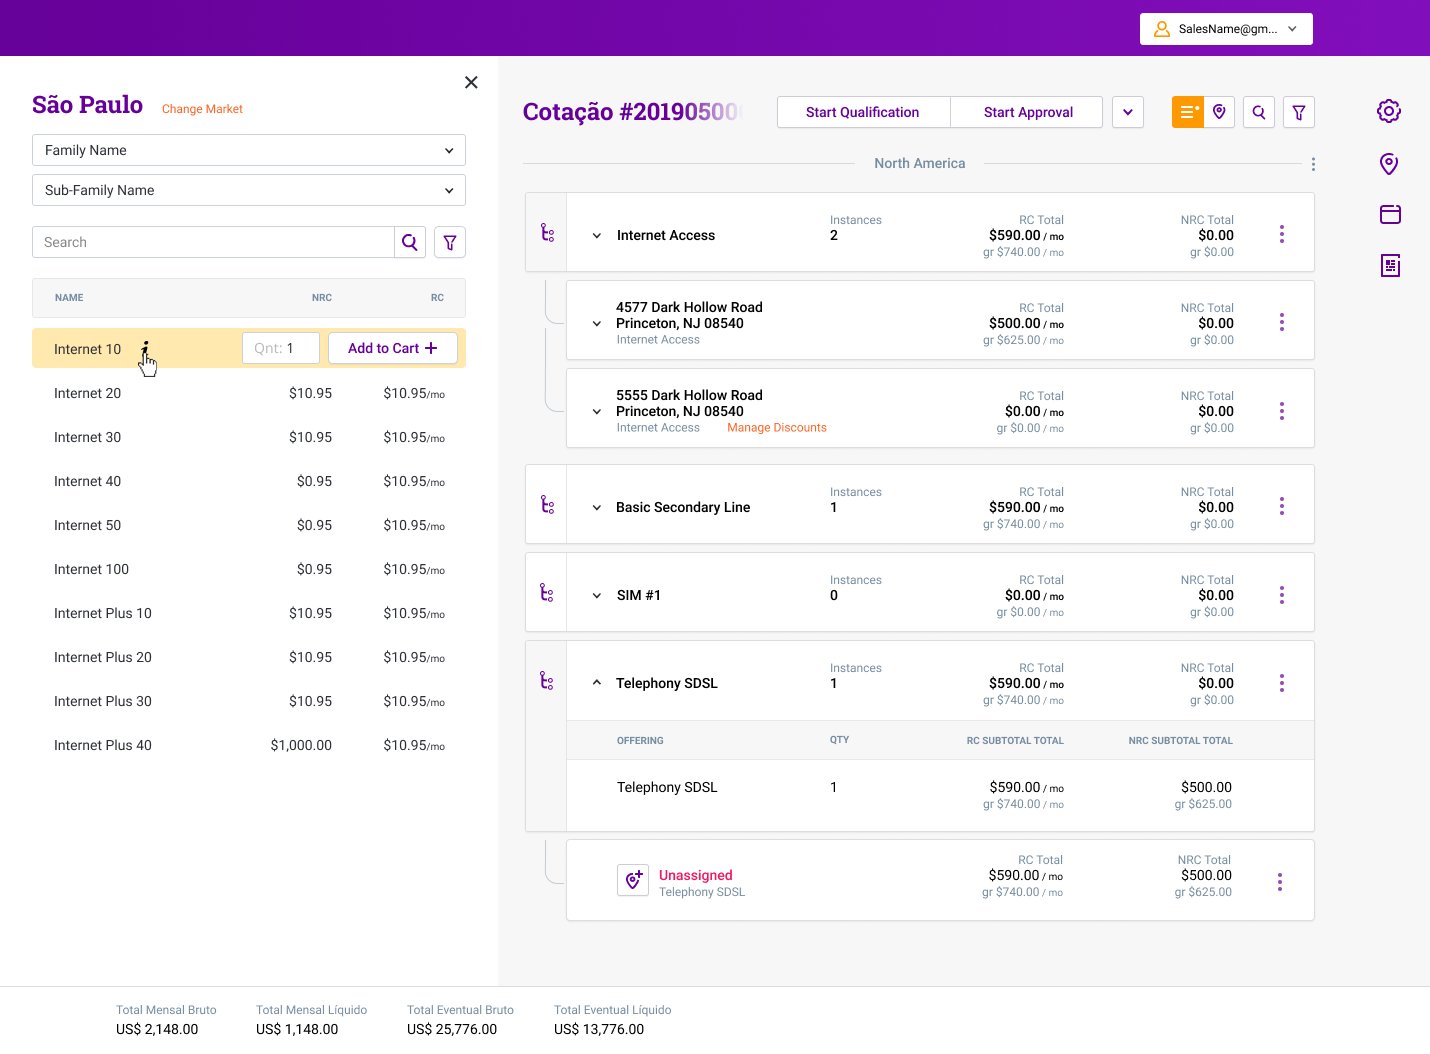
Step 1: Market and product selection. Family and sub-family catalog with add-to-cart. Replaces manual product lookup across separate tools.
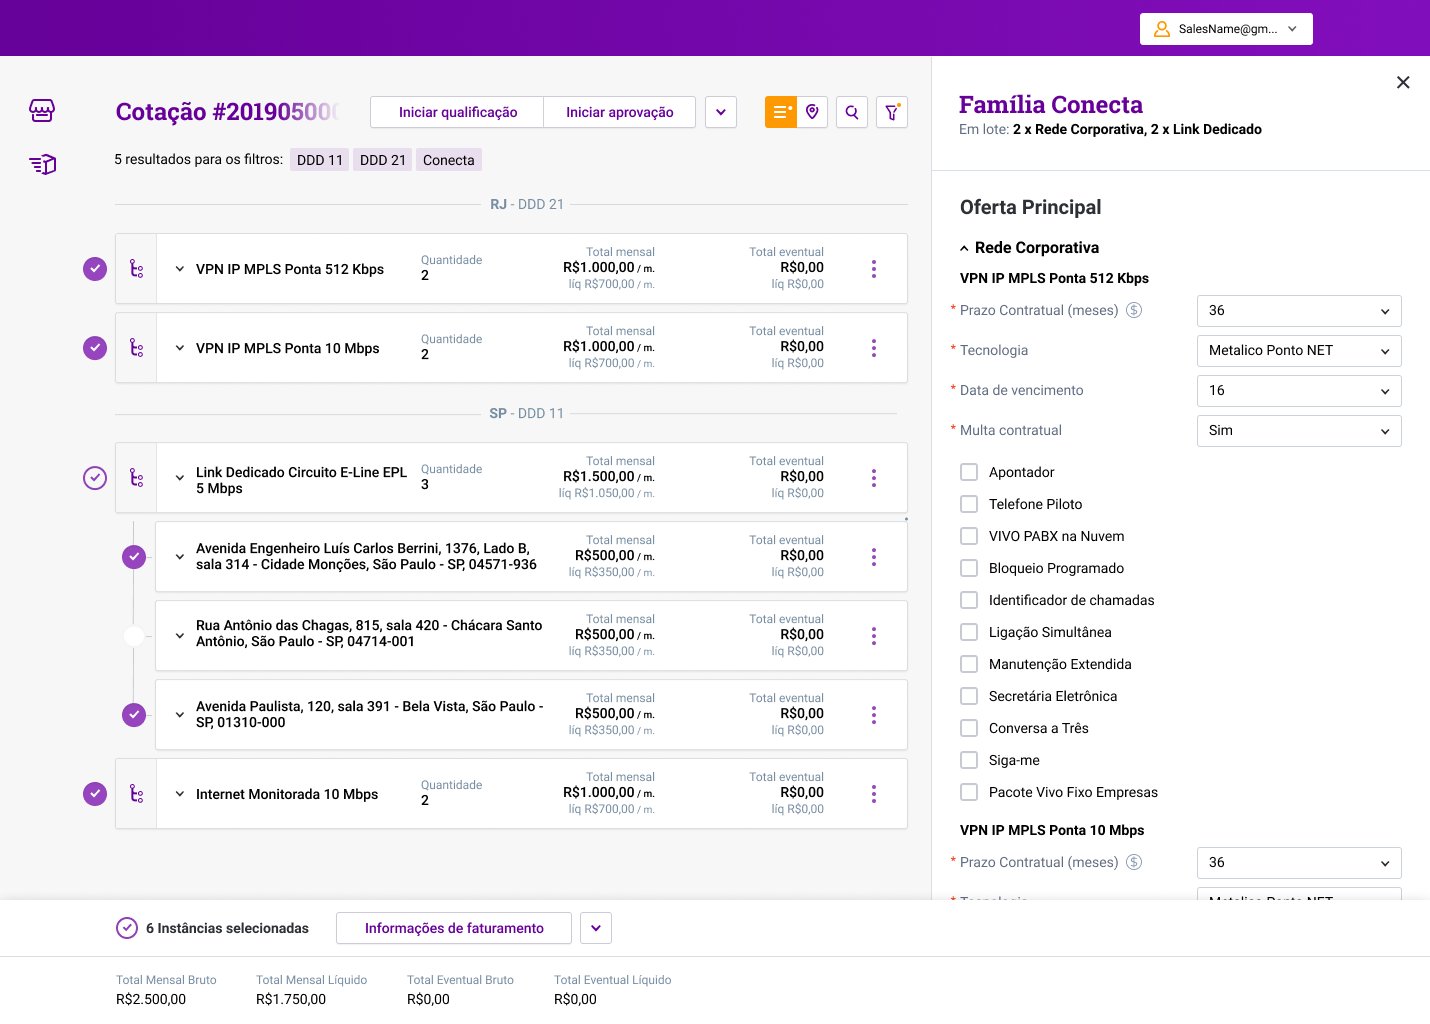
Step 2: Quotation view. Products grouped by location, pricing calculated in real time. Approval initiated from within the same screen.
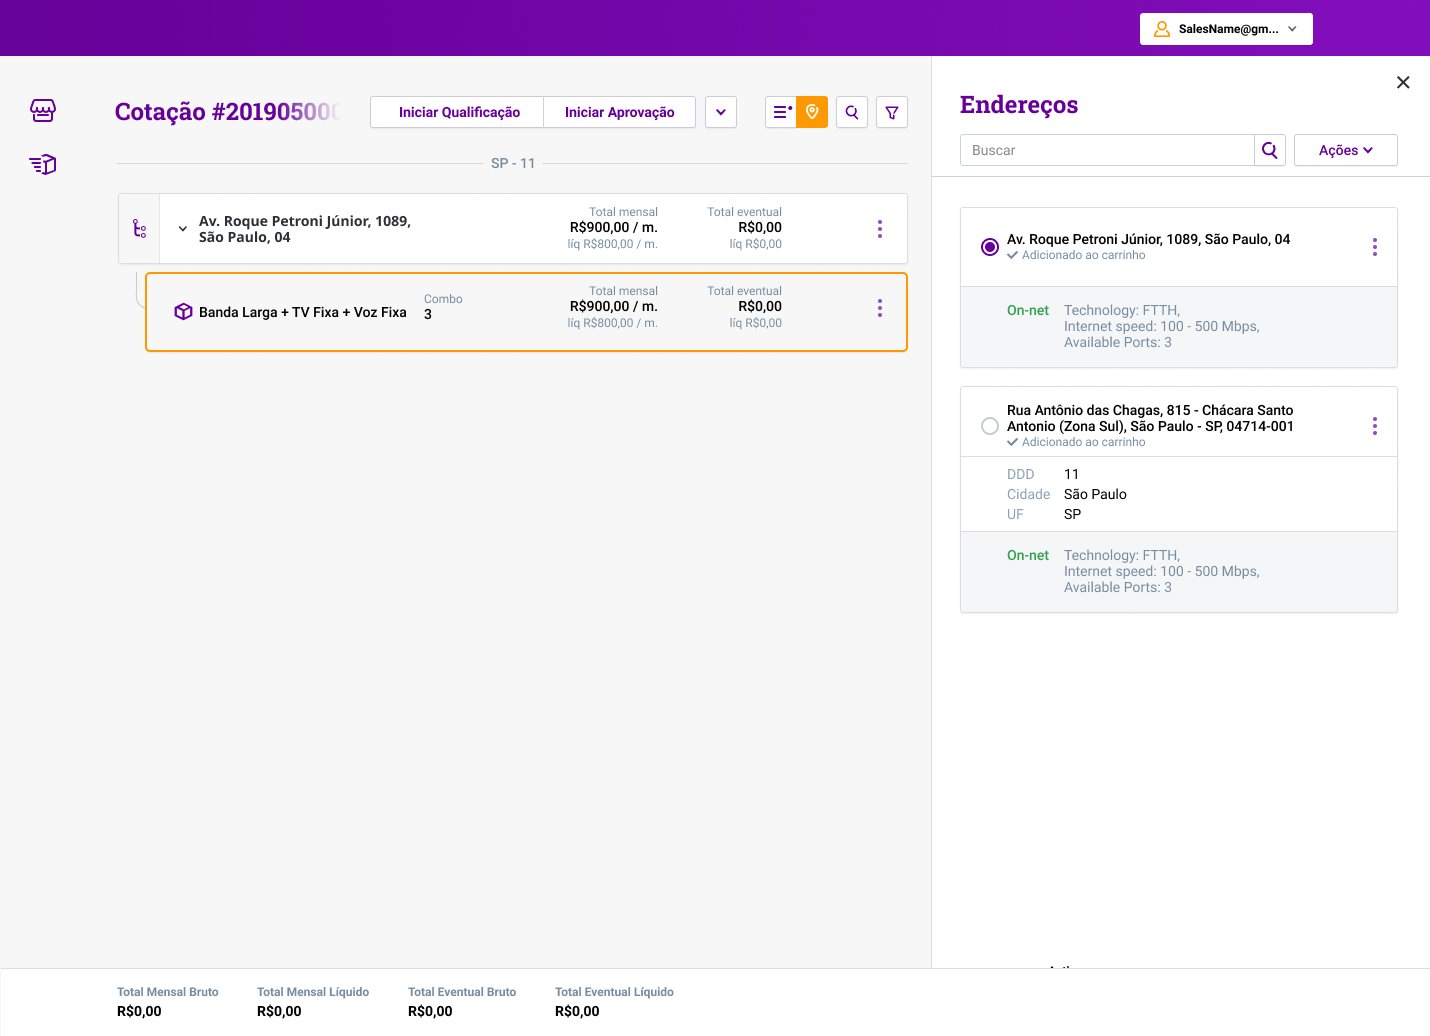
Step 3: Geographic configuration. Address-level product assignment with on-net technology details surfaced inline.
7 tools to 3-step flow compression
Before: 7 separate tools, ~60 min. After: 3 steps, single interface, ~15 min.